
On HTTP Load Testing
Wednesday, 18 May 2011
A lot of people seem to be talking about and performing load tests on HTTP servers, perhaps because there’s a lot more choice of servers these days.
That’s great, but I see a lot of the same mistakes being made, making the conclusions doubtful at best. Having spent a fair amount of time benchmarking high-performance proxy caches and origin servers for my day job, here are a few things that I think are important to keep in mind.
It’s not the final word, but hopefully it’ll help start a discussion.
0. Consistency.
The most important thing to get right is to test the same time, every time. Any changes in the system — whether its an OS upgrade or another app running and stealing bandwidth or CPU — can affect your test results, so you need to be aggressive about nailing down the test environment.
While it’s tempting to say that the way to achieve this is to run everything on VMs, I’m not convinced that adding another layer of abstraction (as well as more processes running on the host OS) is going to lead to more consistent results. Because of this, dedicated hardware is best. Failing that, just run all of the tests you can in one session, and make it clear that comparisons between different sessions don’t work.
1. One Machine, One Job.
The most common mistake I see people making is benchmarking a server on the same box where the load is generated. This doesn’t just put your results out a little bit, it makes them completely unreliable, because the load generator’s “steal” of resources varies depending on how the server handles the load, which depends on resource availability.
The best way to maintain consistency is to have dedicated, separate hardware for the test subject and load generator, and to test on a closed network. This isn’t very expensive; you don’t need the latest-and-greatest to compare apples to apples, it just has to be consistent.
So, if you see someone saying that they benchmarked on localhost, or if they fail to say how many boxes they used to generate and serve the load, ignore the results; at best they’ll only be a basic indication, and at the worst the’ll be very misleading.
2. Check the Network.
Before each test, you need to understand how much capacity your network has, so that you’ll know when it’s limiting your test, rather than the server your’e testing.
One way to do this is with iperf:
qa1:~> iperf -c qa2
------------------------------------------------------------
Client connecting to qa2, TCP port 5001
TCP window size: 16.0 KByte (default)
------------------------------------------------------------
[3] local 192.168.1.106 port 56014 connected with 192.168.1.107 port 5001
[ID] Interval Transfer Bandwidth
[3] 0.0-10.0 sec 1.10 GBytes 943 Mbits/sec
… which shows that I have about 943 Mbits a second available on my Gigabit network (it’s not 1,000 because of TCP overheads).
Once you know the bandwidth available, you need to make sure that it isn’t a limiting factor. There are a number of ways to do this, but the easiest is to use a tool that keeps track of the traffic in use. For example, httperf shows bandwidth use like this:
Net I/O: 23399.7 KB/s (191.7*10^6 bps)
… which tells me that I’m only using about 192 Mbits of my Gigabit in this test.
Keep in mind that the numbers you see from a load generation tool are not going to include the overhead of TCP, and if your load varies throughout the test, it can burst higher than the average. Also, sheer bandwidth isn’t the whole story — for example, if you’re using cheap NICs or switches (you are using a switch, right?), they can be swamped by the sheer number of network segments flying around.
For all of these reasons and more, it’s a good idea to make sure your tests don’t get very close to the available bandwidth you measure; instead, make sure the bandwidth used doesn’t exceed a proportion of it (e.g., 2/3). Monitoring your network (both the interfaces and the switch) for errors and peak rates is also a good idea.
3. Remove OS Limitations.
Likewise, you need to make sure that the operating system doesn’t impose artificial limits on your server’s performance.
TCP tuning is somewhat important here, but it’ll affect all test subjects equally. The important thing is to make sure that your server doesn’t run out of file descriptors.
4. Don’t Test the Client.
Modern, high-performance servers make it very easy to mistake limitations in your load generator for the capacity of the server you’re testing. So, check to make sure your client box isn’t maxed out on CPU, and if there’s any doubt whatsoever, use more than one load generation box to double-check your numbers ( autobench makes this relatively painless).
It also helps to assure that your load generation hardware is better than the server hardware you’re testing; e.g., I generate load with a four-core i5-750 box, and run the server on a slower, two-core i3-350 box, often only using one of the cores.
Another factor to be mindful of is client-side errors, especially running out of ephemeral ports. There are lots of strategies for this, from expanding the port range on your box, to setting up multiple interfaces on the box and making sure that the client uses them (sometimes tricker than it sounds). You can also tune the TIME_WAIT period (as long as it’s ONLY a test box!), or just use HTTP persistent connections and aggressive client-side timeouts to make sure your connection rate doesn’t exceed available ports.
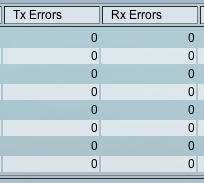
One of the things I like about httperf is that it gives a summary of errors at the end of the run:
Errors: total 0 client-timo 0 socket-timo 0 connrefused 0 connreset 0
Errors: fd-unavail 0 addrunavail 0 ftab-full 0 other 0
Here, the server-originated issues are on the first line (such as the request timing out due to the server exceeding the --timeout option, or when it refuses or resets a connection), and the client-side errors (like running out of file descriptors or addresses) on the second line.
This helps you know when the test itself is faulty.
5. Overload is not Capacity.
Many — if not most — load generation tools will by default throw as much load as they can at a server, and report that number back.
This is great for finding out how your server reacts to overload — an important thing to know — but it doesn’t really show the capacity of your server. That’s because pretty much every server loses some capacity once you throw more work at it than it can handle.
A better way to get an idea of capacity is to test your server at progressively higher loads, until it reaches capacity and then backs off; you should be able to graph it as a curve that peaks and then backs off. How much it backs off will indicate how well your server deals with overload.
autobench is one way to do this with httperf; it allows you to specify a range of rates to test at, so that you can generate graphs like this:
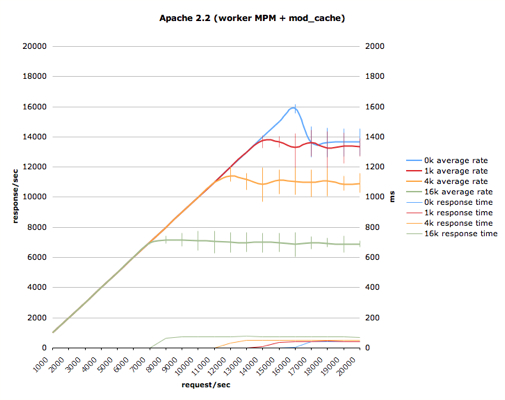
Here, you can see that, for the smallest response size, the server peaks at 16,000 responses/second, but quickly drops down to 14,000 responses/second under overload (with a corresponding jump up to about 60ms response latency). Other response sizes don’t drop as much when overloaded, but you can see the error bars pop up, which shows it struggling.
6. Thirty Seconds isn’t a Test.
It takes a while for the various layers of buffers and caches in the applications, OS and network stacks to stabilise, so a 30 second test can be very misleading. If you’re going to release numbers, test for at least three minutes, preferably more like five or ten.
7. Do More than Hello World.
Finding out how quickly your implementation can serve a 4-byte response body is an interested but extremely limited look at how it performs. What happens when the response body is 4k — or 100k — is often much more interesting, and more representative of how it’ll handle real-life load.
Another thing to look at is how it handles load with a large number — say, 10,000 — of outstanding idle persistent connections (opened with a separate tool). A decent, modern server shouldn’t be bothered by this, but it causes issues more often than you’d think.
These are just two examples, of course.
8. Not Just Averages.
If someone tells you that a server does 1,000 responses a second with an average latency of 5ms, that’s great. But what if some of those responses took 100ms? They can still achieve that average. What if for 10% of the test period, the server was only able to achieve 500 responses a second, because it was doing garbage collection?
Averages are quick indicators, nothing more. Timelines and histograms contain a lot of critical information that they omit. If your testing tool doesn’t provide this information, find one that does (or submit a patch, if it’s Open Source).
Here’s what httperf shows:
Total: connections 180000 requests 180000 replies 180000 test-duration 179.901 s

Connection rate: 1000.0 conn/s (99.9 ms/conn, <=2 concurrent connections)
Connection time [ms]: min 0.4 avg 0.5 max 12.9 median 0.5 stddev 0.4
Connection time [ms]: connect 0.1
Connection length [replies/conn]: 1.000

Request rate: 1000.0 req/s (.9 ms/req)
Request size [B]: 79.0

Reply rate [replies/s]: min 999.1 avg 1000.0 max 1000.2 stddev 0.1 (35 samples)
Reply time [ms]: response 0.4 transfer 0.0
Reply size [B]: header 385.0 content 1176.0 footer 0.0 (total 1561.0)
Reply status: 1xx=0 2xx=0 3xx=0 4xx=1800 5xx=0
Here, you can see not only the average response rates, but also a min, max and standard deviation. Likewise for connection time.
9. Publish it All.
A result given without enough information to reproduce it is at best a useless statement that requires people to take it on faith (a bad idea), and at worst an intentional effort to mislead. Publish your results with all of the context of the test; not only the hardware you used, but also OS versions and configurations, network setup (with iperf results), server and load generator versions and configuration, workload used, and source code if necessary.
Ideally, this would take the form of a repository (e.g., on github) that allows anyone to reproduce your results (for their hardware) with as little overhead as possible.
10. Try Different Tools.
If you got this far, you might think I’m championing httperf and autobench over other tools. While I’d like to have a single singing, dancing test tool, httperf is unfortunately not it; for modern servers, it’s simply too slow, mostly because it doesn’t implement an event loop. While that’s fine for testing PHP apps that can do 50 or 500 requests a second, it’s completely inadequate for testing modern Web servers that can do multiple tens of thousands of requests a second without breaking a sweat.
Additionally, if you just use one tool, there’s a chance that there’s a weird interaction between the client and server which disadvantages some implementations more than others. For example, some tools don’t do persistent connections in a way that works well with some servers, causing their numbers to dip.
What I do like about httperf is covered above; its focus on statistics, error reporting and customisable load rate makes it a great way to really get to know your server, rather than just throw a lot of load at it. What I’m hoping is that other load testing tools will take notice and start giving the same level of information.
Another tool I’ve been using recently is siege; it doesn’t have quite the same information available as httperf, but it does pretty well, and goes wicked fast.